Normal Blood Sugar Levels by Age (Chart: 40 to 70+)
Quick Answer: A normal blood sugar level is below 100 mg/dL when fasting, and below 140 mg/dL two hours after a meal. Fasting readings of 100 to 125 mg/dL signal prediabetes, and 126 mg/dL or higher on two tests points to diabetes. For A1C, below 5.7% is normal, 5.7% to 6.4% is prediabetes, and 6.5% or higher is diabetes.
When my A1C came back at 6.1%, I had a number I did not understand and no chart to compare it to. It took me a lot of reading to figure out what “normal” actually meant, and I promised myself I would put it all in one place someday.
This is that place. Below you will find the full reference for normal blood sugar levels by age, fasting and after eating, plus how the A1C fits in. I brought my own A1C from 6.1% down to 5.4% over more than three months, without medication, so I know these numbers are not just abstract targets. They are the map you use to find your way back.
Let me walk you through every range, when it shifts with age, and how to read your own result without panic.
Key Takeaways
- A normal fasting blood sugar is under 100 mg/dL; 100 to 125 mg/dL is prediabetes and 126 mg/dL or higher is diabetes.
- Two hours after eating, under 140 mg/dL is normal for most adults; 140 to 199 mg/dL suggests prediabetes.
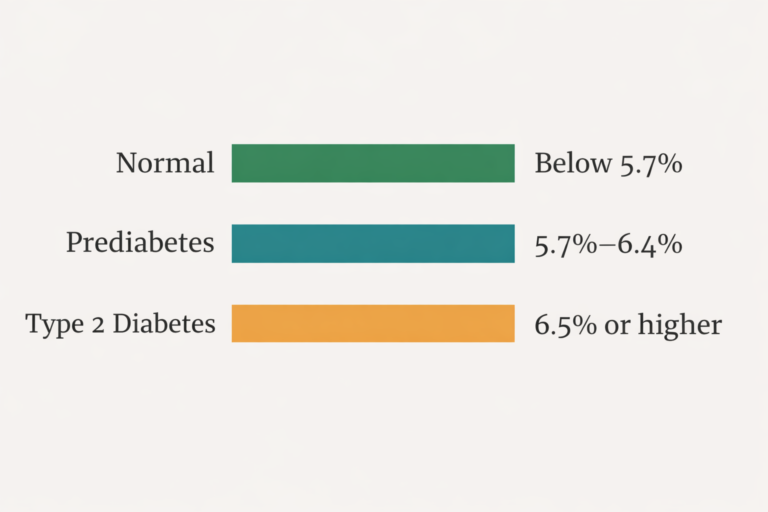
- A1C reflects your average sugar over three months: under 5.7% normal, 5.7% to 6.4% prediabetes, 6.5% or higher diabetes.
- Targets loosen slightly for many older adults and tighten during pregnancy, but the core cutoffs stay the same.
- One high reading is not a diagnosis; patterns over time and repeat testing are what matter.
The core numbers: normal, prediabetes, and diabetes
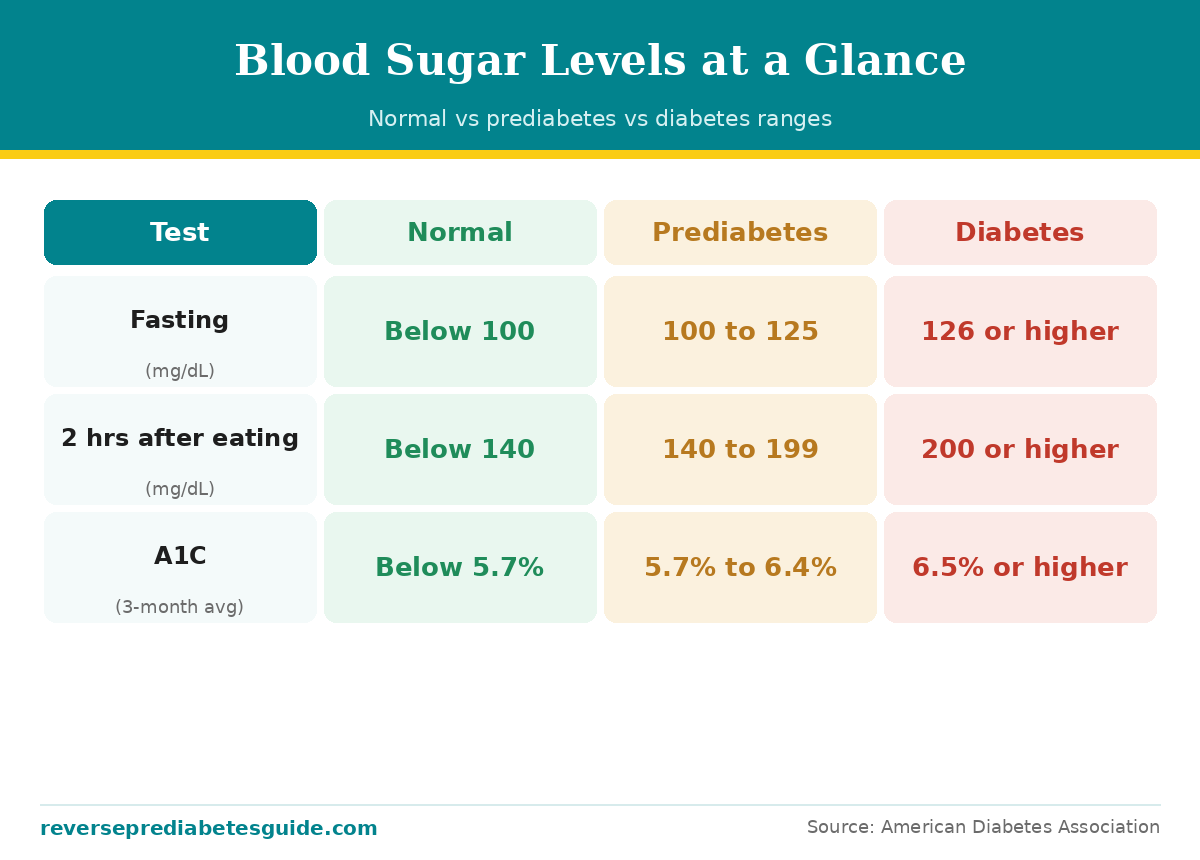
Every blood sugar conversation comes back to four measurements: fasting glucose, post-meal glucose, a random reading, and A1C. The American Diabetes Association sets the cutoffs, and they are the same ones your doctor uses. Here is the master chart.
| Test | Normal | Prediabetes | Diabetes |
|---|---|---|---|
| Fasting (8+ hours, no food) | Below 100 mg/dL | 100 to 125 mg/dL | 126 mg/dL or higher |
| 2 hours after eating (or OGTT) | Below 140 mg/dL | 140 to 199 mg/dL | 200 mg/dL or higher |
| Random (any time of day) | Below 140 mg/dL | 140 to 199 mg/dL | 200 mg/dL or higher with symptoms |
| A1C (3-month average) | Below 5.7% | 5.7% to 6.4% | 6.5% or higher |
These thresholds come straight from the American Diabetes Association’s diagnosis criteria. A diagnosis of diabetes usually needs two abnormal results, either two of the same test or two different tests, unless your sugar is very high with clear symptoms.
If your fasting number is sitting in that 100 to 125 range, I wrote a deeper breakdown of what those figures mean day to day in my guide to the prediabetes A1C range explained. It is the first thing I wish someone had handed me.
Does normal blood sugar change with age?
This is the question I get most, and the honest answer is: the diagnostic cutoffs do not change with age, but the targets your doctor recommends often do. A fasting reading of 110 mg/dL means prediabetes whether you are 30 or 70. What shifts is how aggressively we chase a “perfect” number.
For most healthy adults, the goal is the standard normal range. For older adults with multiple health conditions, doctors sometimes accept slightly higher numbers to avoid the risk of blood sugar dropping too low. The table below shows how those practical targets tend to land.
| Group / context | Typical fasting target | Typical A1C target |
|---|---|---|
| Children and teens (general) | 70 to 100 mg/dL | Below 5.7% |
| Healthy adults (18 to 59) | 70 to 99 mg/dL | Below 5.7% |
| Adults 60 to 70, otherwise healthy | 70 to 99 mg/dL | Below 5.7% |
| Older adults with several conditions | 90 to 130 mg/dL (individualized) | Under 7.0% to 8.0% |
| Pregnancy | Below 95 mg/dL fasting | Individualized, tighter |
Notice how the ranges tighten in pregnancy and loosen in frail older age. The Centers for Disease Control offers a clear overview of these considerations in its diabetes basics resources. If you are over 60 and your fasting number crept up to 105, that is worth watching, not worth panicking over.
One thing I want to name gently: many people assume higher blood sugar is just “normal aging.” It is common, yes, but common is not the same as harmless. Rising numbers still deserve attention at any age.
Fasting blood sugar: your morning baseline
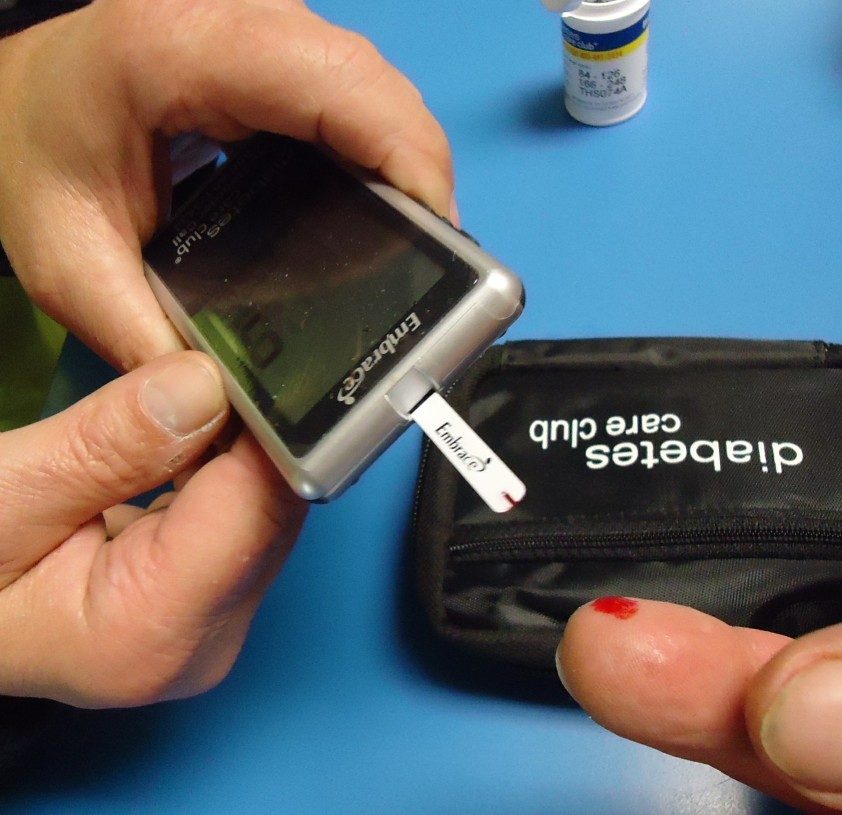
Fasting glucose is the number you get after at least eight hours without food, usually first thing in the morning. It is the cleanest snapshot of how your body handles sugar at rest, which is why it is the most common screening test.
A normal fasting level is anything under 100 mg/dL. Once you cross into the 100 to 125 range, your body is showing early insulin resistance.
Here is a detail that trips people up: fasting sugar can actually rise overnight because of a normal hormone surge before dawn, sometimes called the dawn phenomenon. So a slightly high morning reading is not always about last night’s dinner. Testing on a few different mornings gives you a truer picture than one number.
Blood sugar after eating: the post-meal window
What your sugar does after a meal is one of the earliest warning signs, often rising before your fasting number does. Two hours after you start eating, a normal reading stays under 140 mg/dL. Prediabetes shows up as 140 to 199 mg/dL, and 200 or above points toward diabetes.
This post-meal spike is where diet makes the fastest difference. Swapping morning toast and juice for eggs and greens is one of the simplest ways to soften that rise. If you want to understand this pattern in detail, I put together a full guide on blood sugar after eating with prediabetes.
Some meals reliably push sugar higher than others. Refined carbs and sugary drinks spike fast; protein, fat, and fiber slow the rise. If you are trying to flatten those peaks, my list of foods that lower blood sugar quickly is where I would start.
Random blood sugar and what it tells you
A random blood sugar test is taken at any time, regardless of when you last ate. On its own it is a looser measure, but a random reading of 200 mg/dL or higher, especially with symptoms like heavy thirst or frequent urination, is a strong signal that needs follow-up testing.
For most people without symptoms, a random reading under 140 mg/dL is reassuring. Random checks are mostly useful for catching surprises, like how a stressful afternoon or poor sleep can nudge numbers up even without food.
Understanding your A1C
The A1C is my favorite number because it cannot be fooled by one good breakfast. It measures the percentage of your red blood cells coated with sugar, which reflects your average glucose over roughly three months. That makes it the truest long-term scorecard. If yours is edging up, I also put together a plain guide to the vitamins and supplements that support a healthy A1C.
| A1C | Estimated average glucose | Category |
|---|---|---|
| 5.0% | 97 mg/dL | Normal |
| 5.6% | 114 mg/dL | Normal (high end) |
| 5.7% | 117 mg/dL | Prediabetes (start) |
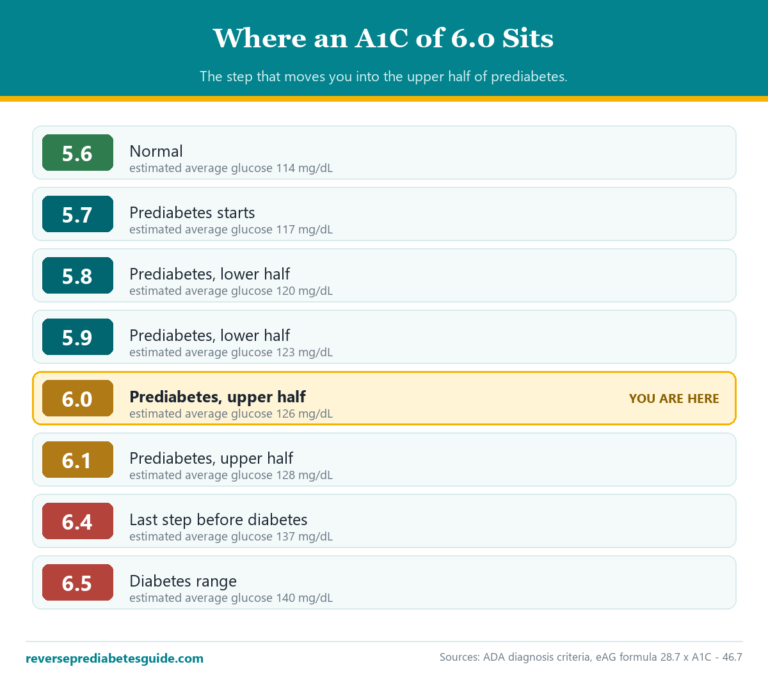
| 6.0% | 126 mg/dL | Prediabetes |
| 6.4% | 137 mg/dL | Prediabetes (high end) |
| 6.5% | 140 mg/dL | Diabetes (start) |
The National Institute of Diabetes and Digestive and Kidney Diseases explains the A1C test and its estimated averages in its A1C overview. Seeing my own 6.1% translate to an average of about 128 mg/dL made the whole thing real for me.
The encouraging part is that A1C moves. Because it turns over every few months, the choices you make now show up on your next test. That is exactly why so many people can pull their number back into the normal range with steady changes, which I walk through in how long it takes to reverse prediabetes.
A quick note on units and meter accuracy
Every number on this page is in mg/dL, the unit used across the United States. Much of the rest of the world uses mmol/L, so if you see a chart with tiny numbers like 5.5, that is the same scale in different clothes. To convert mg/dL to mmol/L, divide by 18. So a fasting reading of 108 mg/dL is about 6.0 mmol/L.
It also helps to know that home glucose meters are not perfect. Most are accurate within about 15 percent of a lab result, which means a meter reading of 100 could truly be anywhere from roughly 85 to 115. That is another reason I trust patterns over any single check, and why a lab-drawn fasting test or A1C carries more weight than a one-off finger stick.
Small habits also skew readings. Not washing your hands before a finger stick, testing right after coffee, or using an old strip can all nudge the number. When something looks surprising, wash your hands and test again before you read anything into it.
How to read your own number without panic
When you get a result, resist the urge to treat one figure as your whole story. Ask three questions. Was it fasting or after eating? Is it a repeat pattern or a one-off? And how does it sit against the chart above?
A single fasting reading of 103 is not a diagnosis. It is a nudge to test again on another morning and to look at your habits. Diagnoses rest on repeated results, which is why doctors rarely act on a lone number.
If your readings keep landing in the prediabetes zone, that is genuinely good news in one way: you caught it early, while it is still very responsive to change. Many people do not learn about their sugar until it is much higher.

When should you actually worry?
Worry is the wrong word, but attention is the right one. Book a conversation with your doctor if your fasting numbers repeatedly sit at 100 or above, if your A1C reaches 5.7% or higher, or if you have symptoms like unusual thirst, blurry vision, or fatigue that will not lift.
Certain factors raise the stakes and make earlier testing wise: a family history of diabetes, carrying extra weight around the middle, high blood pressure, or a past pregnancy with gestational diabetes. If several of those apply to you, it is worth running through my prediabetes symptoms checklist to see where you stand.
And if your numbers are creeping up and you are exploring extra support beyond food and movement, I keep an honest reference on supplements people consider for prediabetes and A1C, so you can weigh what the research actually says before spending a dollar.
The bigger picture: numbers move
The reason I care so much about these ranges is that they gave me direction when I felt lost. A number is only frightening when you cannot see the path away from it. Once you know that under 100, under 140, and under 5.7% are the doors back to normal, the whole thing becomes a project instead of a verdict.
Prediabetes is one of the most reversible conditions there is, and the same steps that lower these numbers protect your heart, energy, and sleep along the way. If you want the full roadmap, I laid it out in can prediabetes be reversed naturally.
Frequently Asked Questions
What is a normal blood sugar level for adults?
For most adults, a normal blood sugar level is below 100 mg/dL when fasting and below 140 mg/dL two hours after eating. On an A1C test, normal means below 5.7%. Readings above those points move into the prediabetes range.
Do normal blood sugar levels change with age?
The diagnostic cutoffs stay the same at every age, so 126 mg/dL fasting means diabetes whether you are 25 or 75. What changes is the target your doctor may set. Older adults with several health conditions are sometimes given slightly higher goals to avoid low blood sugar.
What is a normal blood sugar level after eating?
Two hours after starting a meal, a normal blood sugar reading is below 140 mg/dL for most people without diabetes. A reading of 140 to 199 mg/dL suggests prediabetes, and 200 mg/dL or higher points toward diabetes and needs follow-up testing.
Is a blood sugar level of 110 normal?
A fasting level of 110 mg/dL is not in the normal range. It falls inside the prediabetes zone of 100 to 125 mg/dL. One reading is not a diagnosis, so retest on another morning and talk with your doctor about the pattern.
What A1C is considered normal?
An A1C below 5.7% is considered normal. From 5.7% to 6.4% indicates prediabetes, and 6.5% or higher on two tests indicates diabetes. A1C reflects your average blood sugar over about three months rather than a single moment.
What is the normal blood sugar range for seniors over 60?
Healthy seniors follow the same normal range as other adults: under 100 mg/dL fasting and an A1C below 5.7%. For older adults managing several chronic conditions, doctors often accept a fasting range closer to 90 to 130 mg/dL to keep readings safely away from lows.
How can I quickly check if my number is normal?
Match your result to the type of test. Under 100 mg/dL fasting, under 140 mg/dL two hours after eating, and under 5.7% A1C are all normal. Anything above those thresholds is worth a repeat test and a conversation with your doctor.
Before You Go
- Save the master chart above; matching your reading to the right test type is the single most useful skill for reading your own results.
- Test fasting sugar on a few different mornings before drawing conclusions, since normal hormone shifts can nudge a single reading up.
- Watch your two-hour post-meal numbers closely; they often rise first and respond fastest to changes in what you eat.
- If your numbers are in the prediabetes zone, treat it as early warning, not a sentence. It is one of the most reversible stages there is.
Sitting at 6.0? See where an A1C of 6.0 lands and how long it takes to move.